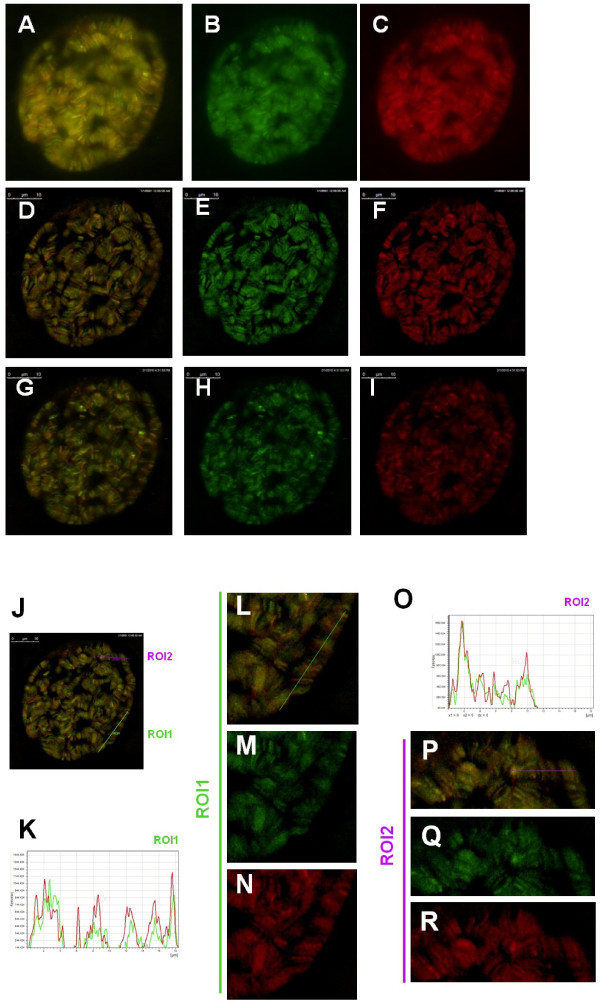
Figure 6.
The N-terminal Cp190 fragment containing the BTB domain and D-rich region colocalizes with the full-length Cp190 protein. (A-I) The distribution of the GFP-CP190BTB-D (green, B, E, H, M, Q) and the mRFP-CP190 (red, C, F, I, N, R) proteins in the cell nucleus of a living salivary gland. (D-F) and (G-I) are two of the optical sections from the same cell shown in (A-C) and were analyzed by deconvolusion algorism. The same deconvolusion processed optical section as (D-F) is marked with the ROI1 (green) and ROI2 (purple) (J). (K-R) The intensity profile chart of the ROI1 (K) and the closer views of ROI1 (L-N). The ROI1 is indicated as a green line in (J) and in (L). The Intensity profile chart of the ROI2(O) and the closer views of ROI2 (P-R). The ROI2 is indicated as a purple line in (P) and in (J).

