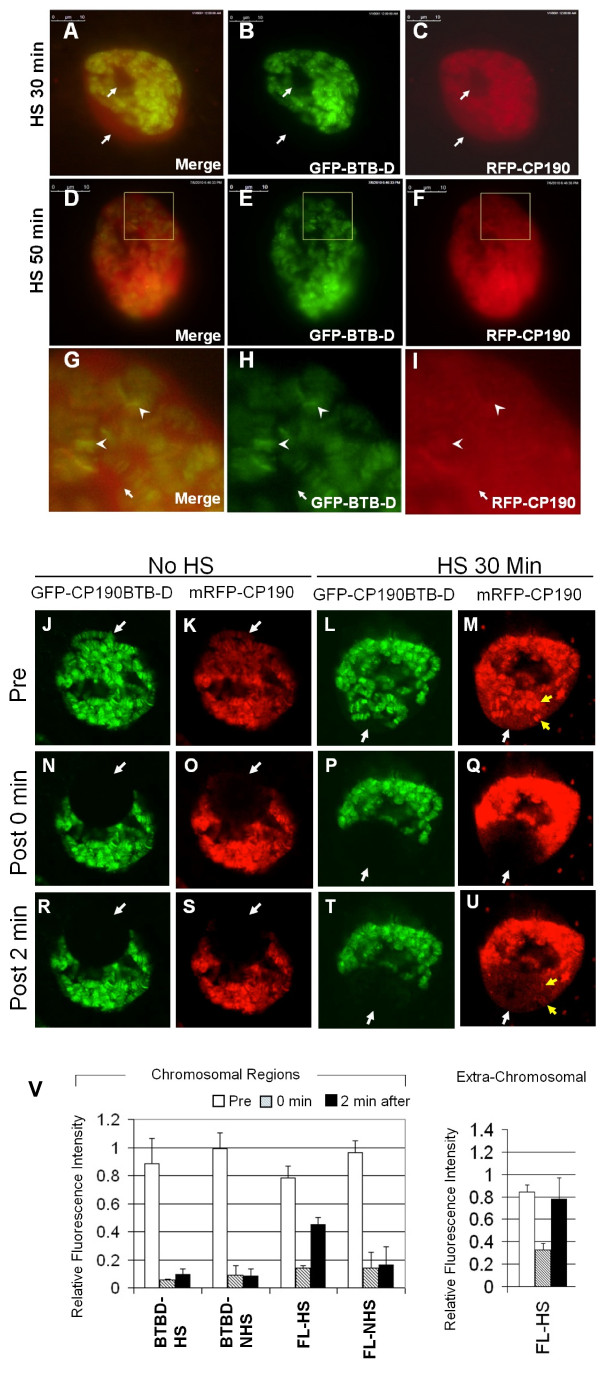
Figure 7.
The full sized Cp190 dissociated from polytene chromosomes during heat-shock while the CP190BTB-D fragment remained bound. (A-I) Salivary glands dissected from 3rd instar larvae expressing both mRFP-CP190 and GFP-CP190BTB-D proteins were treated with heat-shock for 30 minutes (A-C), for 50 minutes (D-I). (J-V) Salivary glands without heat-shock (J, K, N, O, R, S) or heat-shock for 30 mins (L, M, P, Q, T, U) were analyzed by the Fluorescence Recovery After Photobleach (FRAP) technique. The distribution of GFP-CP190BTB-D (green, B, E, and H) and the distribution of mRFP-CP190 (red, C, F, I) indicate that mRFP-CP190 dissociated from the chromosomes and was present in extra-chromosomal spaces (arrows). The squares in D, E, and F mark the region that is enlarged in G, H, and I. The arrow heads in G, H, and I points to two randomly sampled bands of GFP-CP190BTB-D on polytene chromosomes. (J-U) Salivary glands without the pretreatment of heat-shock (J, K, N, O, R, S) or heat-shocked for 30 minutes (L, M, P, Q, T, U) were analyzed by the FRAP technique. Images were taken before photobleaching (J, K, L, M), right after photobleaching (N, O, P, Q) and 2 minutes after photobleaching (R, S, T, U). White arrows point to areas that were photobeached. Yellow arrows point to bands reappeared after photobeaching. (V) Quantitative analysis of the fluorescence of GFP-CP190BTB-D (BTBD) and mRFP-CP190 (FL) before photobleaching (white bars), 0 minute (grey bars) and 2 minutes (black bars) after photobleaching from multiple nuclei (n > = 3) in heat-shocked treated (HS) or non-heat-shocked treated (NHS) salivary glands. The Relative Fluorescence Intensity (RFI) of chromosomal regions (left chart) and the RFI of the mRFP-CP190 in HS nuclei in extra-chromosomal regions (right chart).

