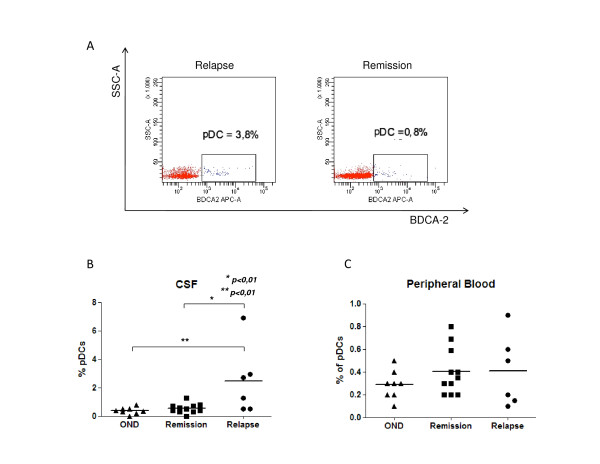
Figure 1.
Concentration of pDCs in relation to other mononuclear cells in CSF and peripheral blood. (A) BDCA2 positive gated CSF cells, dot plot representative of MS patients in relapse and in remission. (B) Percentage of pDCs in CSF, with data points representing individuals of MS patients in relapse (6) and in remission (11) and in other neurological diseases (8). (C) Concentration of pDCs in peripheral blood, with data points representing individuals. Data are shown as median and the statistically significant differences are indicated by *(p < 0.01).

