
Figure 12.
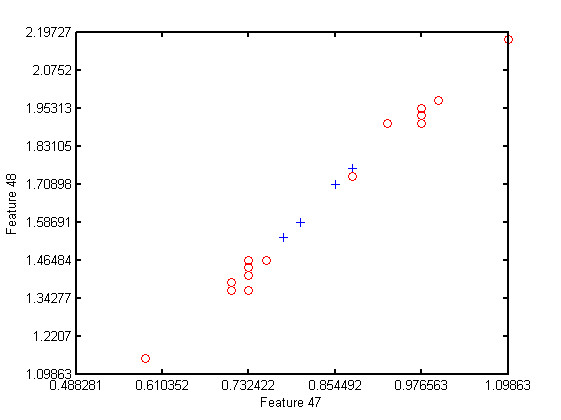
Scatter plot for feature set 47 - 48. Scatter plot for feature set 47 - 48, the fallers are represented by red circles while the non-fallers are represented by blue plus.
Official websites use .gov
A
.gov website belongs to an official
government organization in the United States.
Secure .gov websites use HTTPS
A lock (
) or https:// means you've safely
connected to the .gov website. Share sensitive
information only on official, secure websites.
Scatter plot for feature set 47 - 48. Scatter plot for feature set 47 - 48, the fallers are represented by red circles while the non-fallers are represented by blue plus.