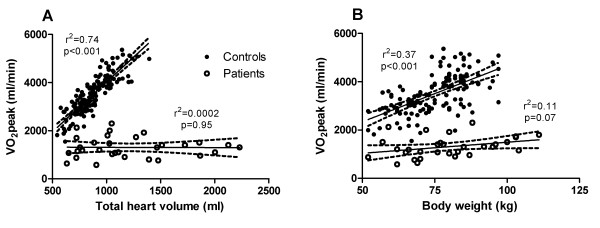
Figure 2.
Peak oxygen uptake in relation to total heart volume and body weight. Peak oxygen uptake (VO2peak) in comparison to A) total heart volume (THV) and B) body weight. Filled circles denote control subjects, including healthy volunteers and athletes and open circles denote heart failure patients. Solid lines represent the regression line and dashed lines the 95% confidence interval. In the control group there was a strong correlation between VO2peak and THV. Even though there was also a significant correlation between VO2peak and body weight, there was a considerable variation of VO2peak for a given body weight.

