
Figure 2.
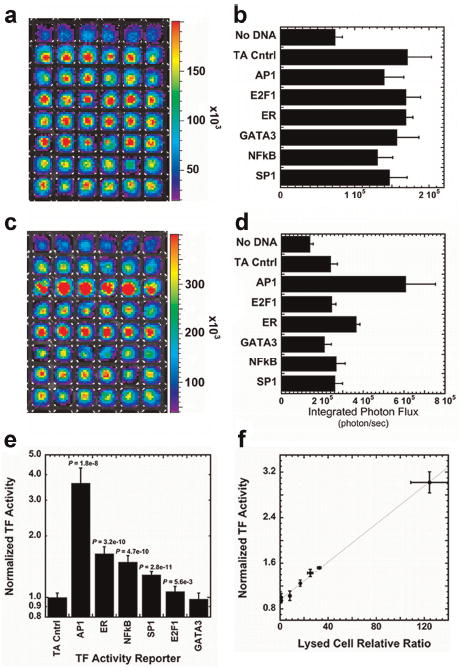
Dual-luciferase reporter constructs to measure TF activity. Dual-luciferase levels were analyzed using bioluminescence imaging 24 h after transfection by first imaging for Renilla luciferase (a and b) and then imaging each array for firefly luciferase (c and d). a and c: Pseudo-color mapping of photon flux localized within wells of the array were quantified to determine average photon fluxes for each well (b and d). e: The raw output for the firefly photon flux of each well was normalized by the photon emission from Renilla luciferase to produce the normalized light emission. f: The TF activity profile for MCF7:WS8 cells using lysed and live cell assays were directly compared using linear regression. The TF activity results were highly correlated (R2 = 0.999). [Color figure can be seen in the online version of this article, available at wileyonlinelibrary.com.]