
Figure 5.
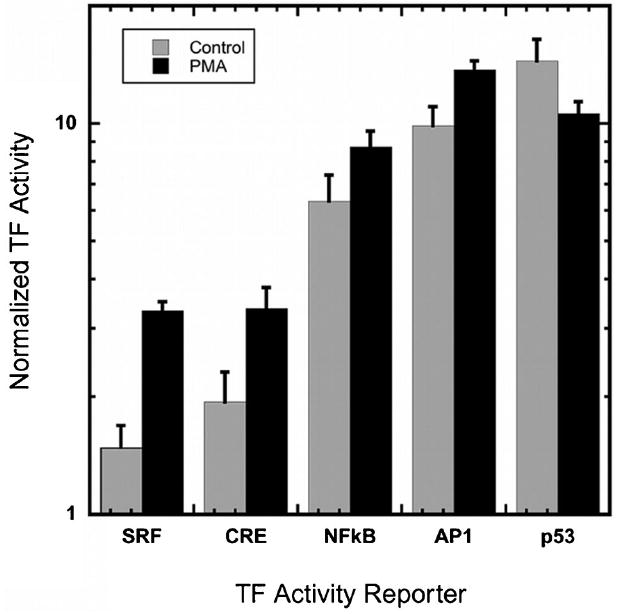
Changes in normalized TF activity profile of MCF7 cells upon induction with PMA. Of the 32 TFs in the array, 5 TFs had differential activity in response to PMA treatment, 4 TFs had increased activity upon PMA induction over vehicle delivery, SRF (+124%), CRE (+73%), NFκB (+38%), and AP1 (+39%), and 1 TF decreased in activity as compared to vehicle delivery (−26%).