
Figure 2.
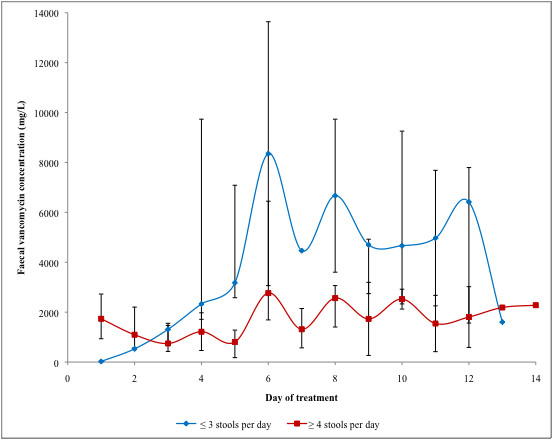
Median faecal vancomycin concentrations achieved in patients stratified according to their stool frequency. * Bars represent range. When no range is indicated, a single specimen was analyzed.
Official websites use .gov
A
.gov website belongs to an official
government organization in the United States.
Secure .gov websites use HTTPS
A lock (
) or https:// means you've safely
connected to the .gov website. Share sensitive
information only on official, secure websites.
Median faecal vancomycin concentrations achieved in patients stratified according to their stool frequency. * Bars represent range. When no range is indicated, a single specimen was analyzed.