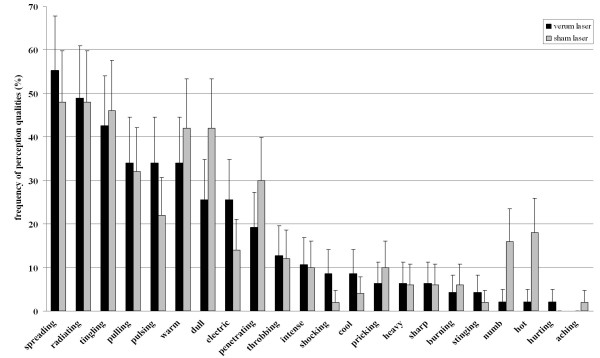
Figure 2.
Comparison of frequencies with which adjectives were used to describe perceptions during acupuncture treatment with the verum laser and the sham laser. Relative frequencies were calculated upon the number of subjects reporting perceptions within each study arm (verum laser group n = 47, sham laser group n = 50). We included errors bars representing the 95% confidence interval for this binary distribution. For more details on data refer to Table three.

