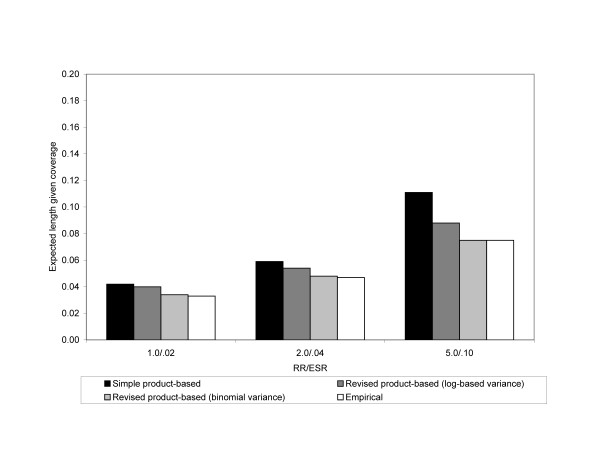
Figure 1.
Expected length given coverage for 95% confidence intervals of the ESRS, ESRR using a log-based variance, and ESRR using a binomial variance in Scenario 1. Empirical 95% confidence intervals are also shown. The analysis assumed an exposure probability of .05 and risk of disease in the unexposed of .02. The x-axis is the magnitude of the RR. Results are from simulations where both N1 and N2 are 5,000.

