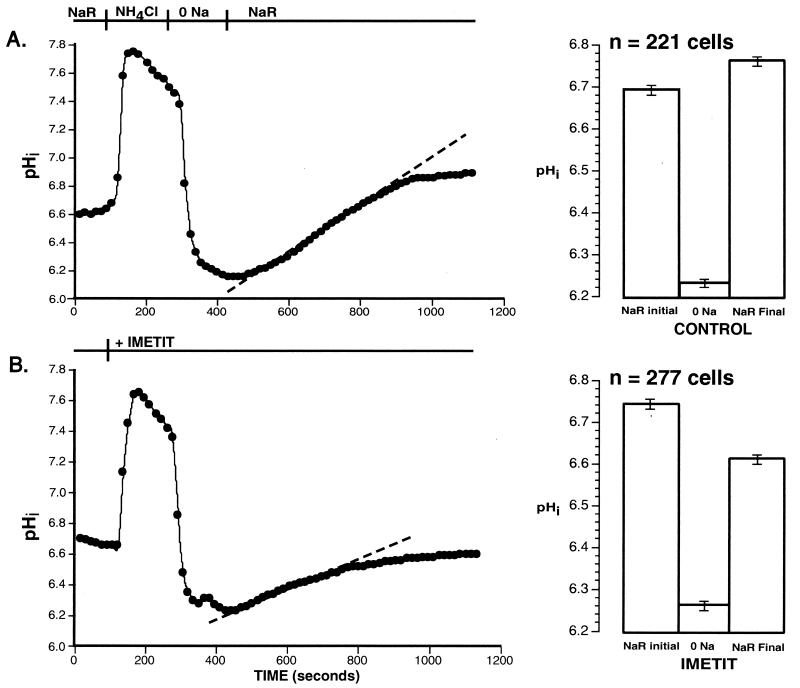
Figure 1.
Representative experimental traces from individual SKNMC-H3 cells showing the Na+-dependent pHi recovery after acute exposure to an NH4Cl acid pulse. (A) A control cell: The y axis represents the pHi as determined from the intracellular calibration of the dye in this cell. The cell was initially superfused with Na+-Ringer's solution (NaR), then with 20 mM NH4Cl. Acute exposure to NH4Cl resulted in acidification of the cytosol to ≈pHi 6.2 after its removal. In the absence of extracellular Na (0 Na), there was no measurable pHi recovery. With the reintroduction of extracellular Na+ (NaR), pHi increased with intracellular alkalinization occurring at a rate of 0.094 pHi units/min (dotted line). The final pHi, achieved in the cell shown in this trace, was higher than the starting pHi (6.8 vs. 6.6). This overshoot of the final pHi relative to the initial resting pHi was seen in the majority of control cells studied and is shown in the bar graph accompanying A. For the 221 control cells studied, the initial pHi was 6.69 ± 0.01 and the final pHi was significantly higher at 6.76 ± 0.01 (P < 0.001). (B) Effect of imetit: The y axis represents pHi as determined from the intracellular calibration of the dye in this cell. Imetit (100 nM) was present in the superfusate from the addition of NH4Cl until the end of the protocol as shown. Acute exposure to NH4Cl resulted in acidification of the cytosol to ≈6.2 after its removal. In the absence of extracellular Na+ (0 Na), there was no measurable pHi recovery. With the reintroduction of extracellular Na+ (NaR), pHi started to increase with intracellular alkalinization occurring at a rate of 0.050 pHi units/min. The mean rate of Na+-dependent pHi recovery was significantly less than that observed in the control cells (P < 0.0001) (Figs. 2 and 3). The final pHi achieved in the cell shown in this trace was lower than the starting pHi (6.7 vs. 6.5). This pHi undershoot relative to the starting pHi was seen in the majority of cells exposed to imetit, as shown in the bar graph of B. Unlike control cells, the final pHi of the 277 imetit-treated cells was significantly lower than the initial pHi (6.61 ± 0.01 vs. 6.74 ± 0.01; P < 0.0001).

