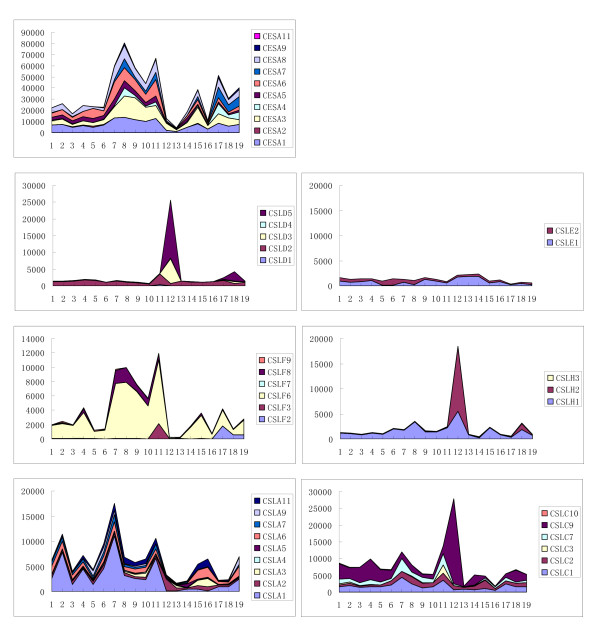
Figure 4.
Accumulative expressions of OsCESA/CSL genes in representative tissues of rice. The y-axis indicates the relative expression level of the genes (signal values from the microarray data) and it is arbitrary. The x-axis indicates the tissues across development stages with 1-3: Calli; 4: Seed imbibition; 5: Young panicle stages 3-5; 6: Young panicle; 7: Plumule; 8: Stem; 9: Young leaf and root; 10: Shoot; 11: Radicle and root; 12: Stamen; 13: Flag leaf; 14: Endosperm 1, 2, 3; 15: Sheath; 16: Old Leaf; 17: Hull; 18: Old panicle; 19: Spikelet.

