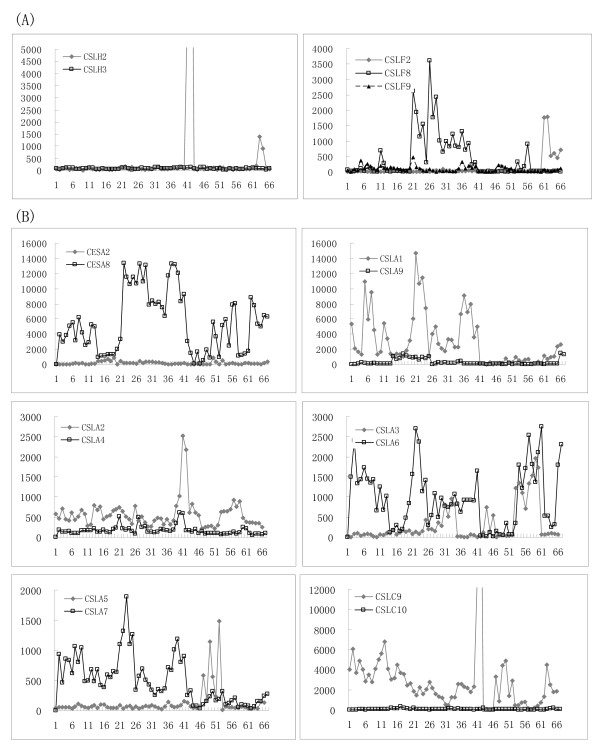
Figure 5.
Expression patterns of the CESA/CSL genes as tandem duplicates (A) and segmental duplicates (B) in rice. The x-axis represents the developmental stages as given in Additional file 1. The y-axis represents the raw expression values obtained from the microarray analysis.

