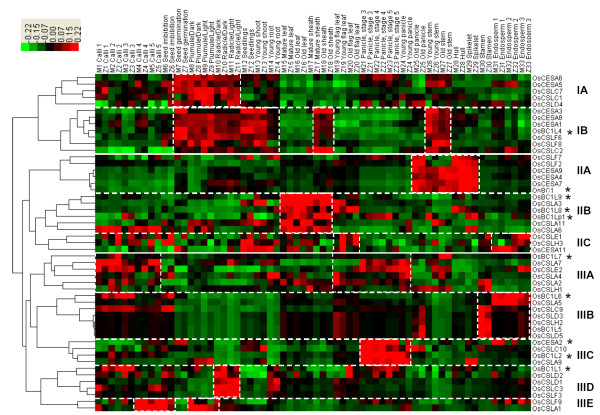
Figure 6.
OsCESA/CSL co-expression profiling in rice. The color scale representing the relative signal values is shown above (green refers to low expression; black refers to medium expression and red refers to high expression). Genes of the brittle culm 1 like family (OsBC1L) were marked with asterisks.

