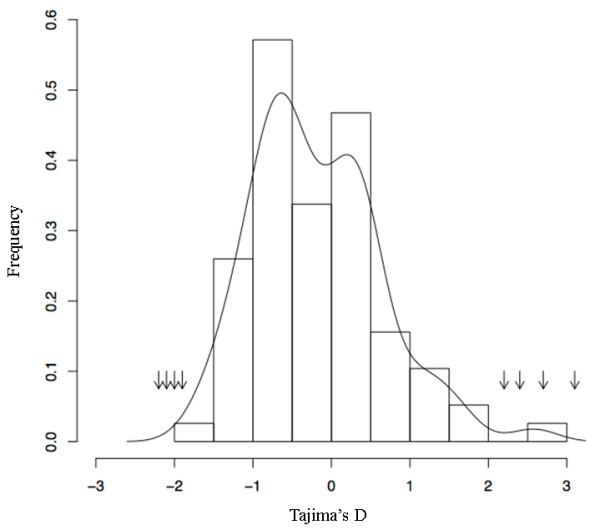
Figure 3.

Distribution in cultivated grapevines of the Tajima's D value calculated from the 77 genes randomly distributed across the genome. The arrows correspond to the Tajima's D value from the eight gene fragments in the flb region with a significant deviation of the Tajima's D value from neutrality.
