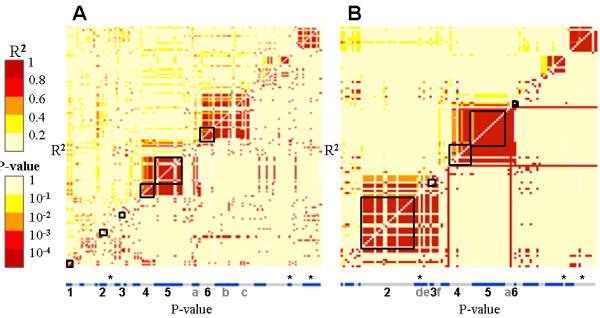
Figure 6.

Linkage disequilibrium along the second flb sub-region in the cultivated and wild compartments. LD plots on R2 values (above the diagonal) and associated P-value (below the diagonal) along the second sub-region containing the 4 gene fragments under selection in the cultivated (A) and wild (B) compartments. The gene fragments re-sequenced are represented by alternate grey and blue boxes, which size is proportional to the number of polymorphic SNP used in the LD estimation. The gene fragments under selection are in black boxes and numbered as follows: "1" for VV05791A, "2" for VVC2897A, "3" for VV05785A, "4" for VVC2901A, "5" for VVC2885A and "6" for VVC2892A. The gene fragments in LD with these genes are pointed with small letter "a" for VV05782A, "b" for VV05781A, "c" for VV05780A, "d" for VV05786A, "e" for VVC2907A and "f" for VVC2891A. Gene fragments with SNP significantly associated with berry weight variation are highlighted with a star.
