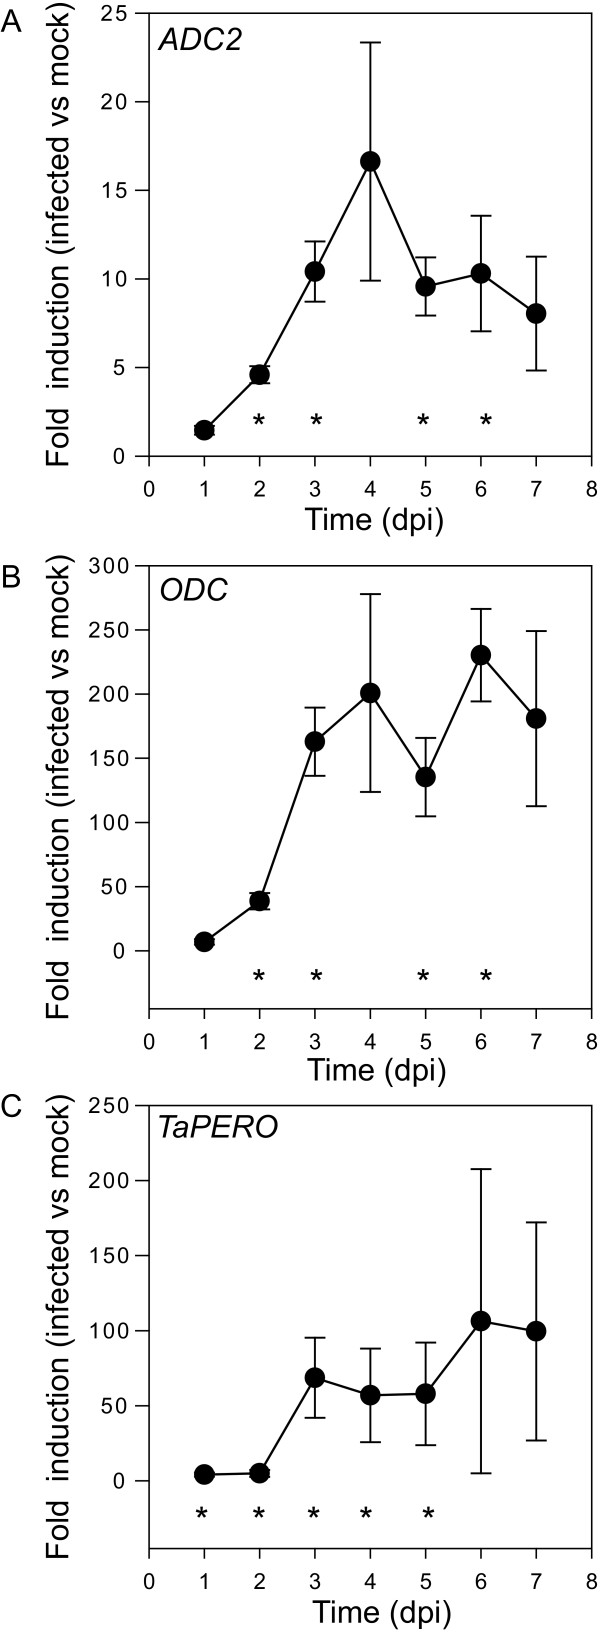
Figure 5.
Expression of genes of the polyamine biosynthesis pathway during Fusarium head blight infection. Values are the relative expression between infected plants compared to mock inoculated plants. Error bars are the standard error of the mean. n = 4 individual heads. Asterisks indicate statistically significant (t-test P < 0.05) differences between infected and mock treated samples at that time point.

