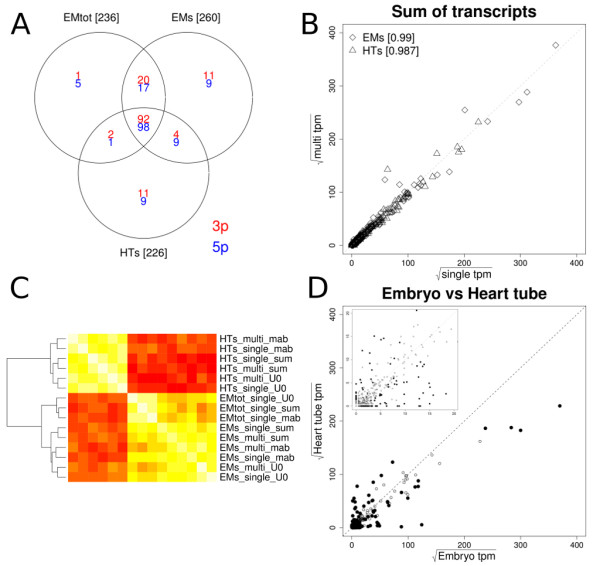
Figure 3.

EM and HT miRNA expression. A: Venn diagram indicating the number of 5p (blue) and 3p (red) miRNA transcripts expressed with at least 5 tpm in either HT or whole embryo libraries. B: Scatter plots comparing the single (x-axis) and multiplex (y-axis) sequencing run for the sum of isomirs per transcripts to calculate miRNA transcript expression levels in sqrt(tpm). Heart tube and Embryo samples are indicated with triangles and diamonds, respectively. Pearson correlation coefficients are indicated at the top of the plot for each summation method. C: Heatmap clustering comparing all samples used in this study. All expressed miRNA transcripts were used to generate this heatmap. Indicated at the right are the tissues (EM & HT), total (tot) or small enriched (s) RNA, the single or multiplex runs. The different summation methods to calculate miRNA transcript expression levels for each sample, i.e., the sum of all isomirs, the sum of uniquely aligned isomirs without mismatches and the most abundant isomir, are indicated with '_sum', '_U0' and '_mab', respectively. Horizontal and vertical labels are identical. D: Scatter plot indicating average miRNA expression in sqrt(tpm) for heart tube (x-axis) and whole embryo (y-axis). Open and closed black circles represent non-significant and significantly differentially expressed miRbase miRNA transcripts respectively. The top left insert depicts an enlarged section of the 0-20 sqrt(tpm) area.
