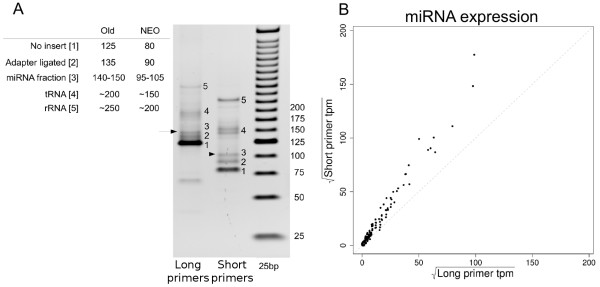
Figure 4.
Short amplification primer libraries. A: 4-12% PAGE gel visualizing improved library fraction separation by using the shorter amplification primers. B: Scatter plot highly correlated miRNA expression levels [sqrt(tpm)] between libraries generated using the long (x-axis) and short (y-axis) amplification primers. Expression levels were calculated relative to the sum of aligned transcripts.

