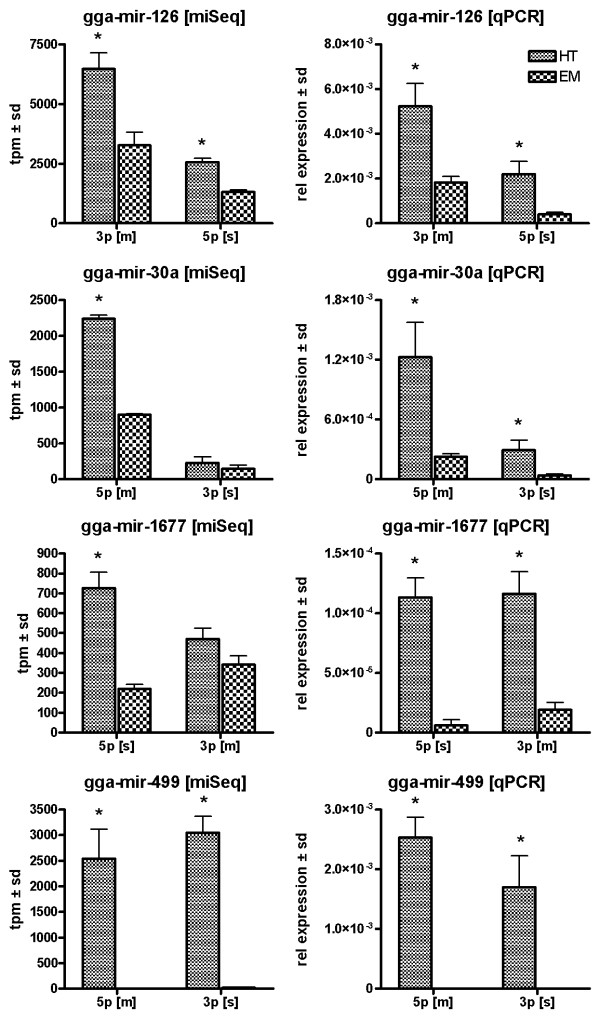
Figure 5.
qPCR confirmation of sequencing data. MicroRNA expression levels for both 5p and 3p transcripts from single precursor transcripts in HH16 whole chicken embryo and heart tube. 5 s rRNA was used as an internal control to normalize gene expression. Left and right column represent miSeq and qPCR derived expression levels, respectively. The bars represent mean expression levels ± sd. * indicates a significant difference in gene expression relative to whole embryo.

