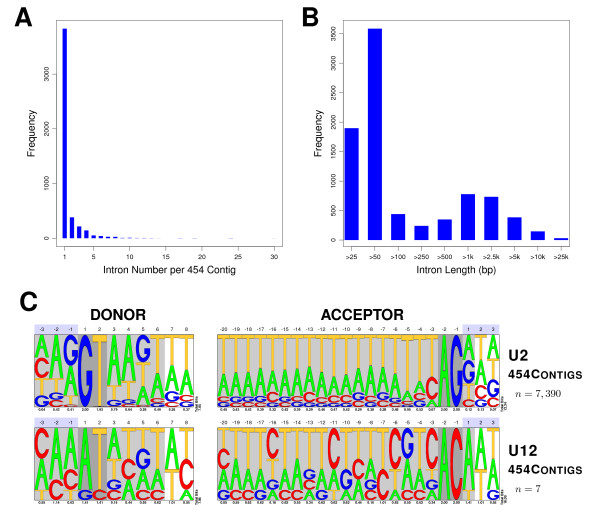
Figure 4.
Analysis of intronic features and splice sites on a set of 90e contigs. A) Distribution of the number of putative introns per 90e contig. B) Length distribution of putative introns. C) Pictograms summarizing the consensus donor and acceptor splice sites for the predicted introns. n corresponds to the number of intron sequences used to compute the nucleotide position weight matrices for the pictograms. Light grey shadowed regions correspond to the commonly used signal lengths for gene-finding, while dark grey ones define the nucleotide boundaries of the introns. Numbers below pictograms are the bit-scores that describe the information content per position.

