
Figure 6.
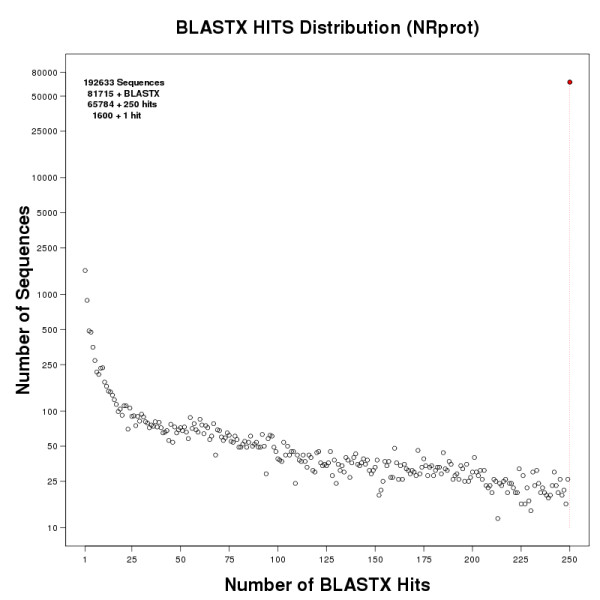
Distribution of BLASTXhits of 90e sequences against NCBI NRprot. Sequences from the 90e dataset were compared against the NCBI NR protein database using BLASTX. The figure shows the distribution of the number of sequences binned by the number of HSPs they had. Y-axis in log scale.