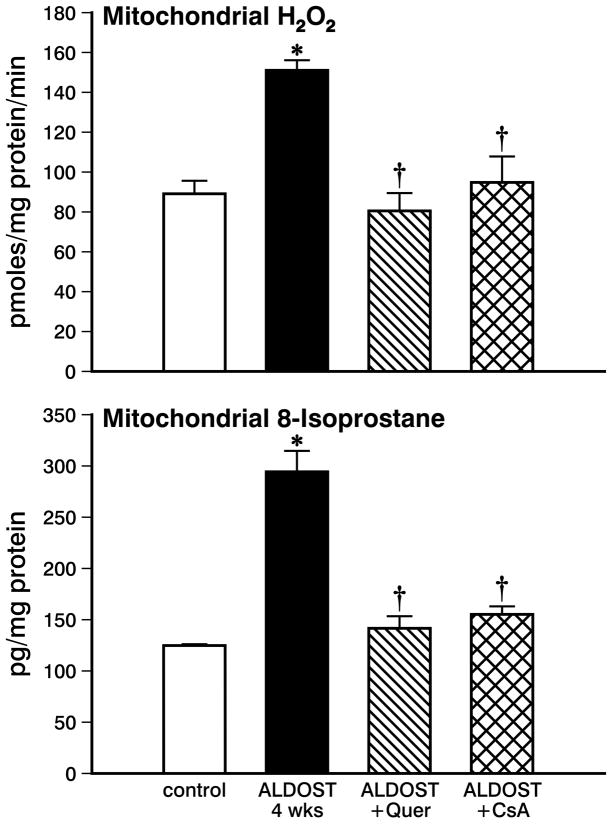
Figure 1.
Mitochondrial H2O2 production and 8-isoprostane levels in organelles harvested from control hearts, with 4 wks aldosterone/salt treatment (ALDOST) alone, with 4 wks ALDOST plus quercetin cotreatment and with 4 wks ALDOST plus cyclosporine A cotreatment. *p<0.05 vs. controls; †p<0.05 vs. 4 wks ALDOST alone.

