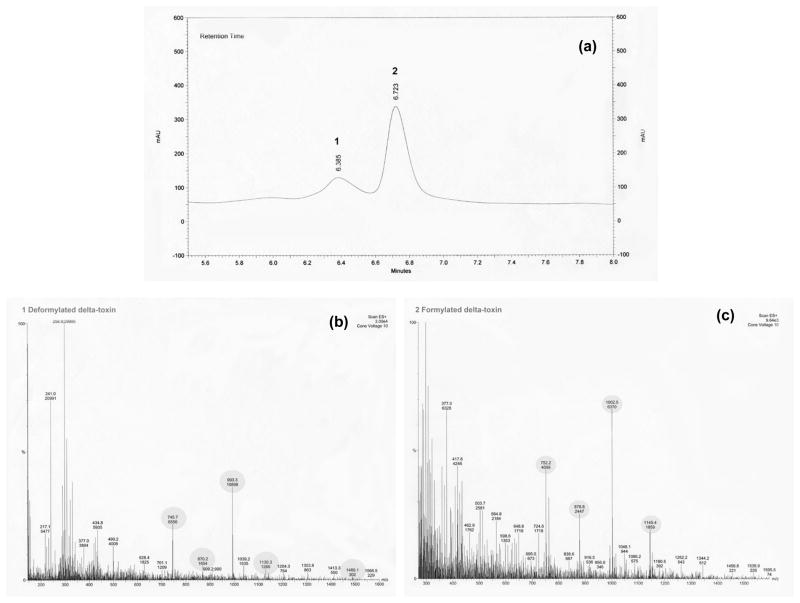
Fig. 1S.
Mass spectroscopic analysis of HPLC fractions containing derformylated and formylated δ-toxin. Peaks matching the spectrogram presented in the study by Somerville et al. [8] are highlighted. (a) Absorbance at 280nm of NRS385 (PFT USA500) supernatant fractionated by HPLC. (b) Mass spectrogram of peak 1, deformylated δ-toxin (molecular mass 2979.2 Da). (c) Mass spectrogram of peak 2, formylated δ-toxin (molecular mass of 3007.4 Da).

