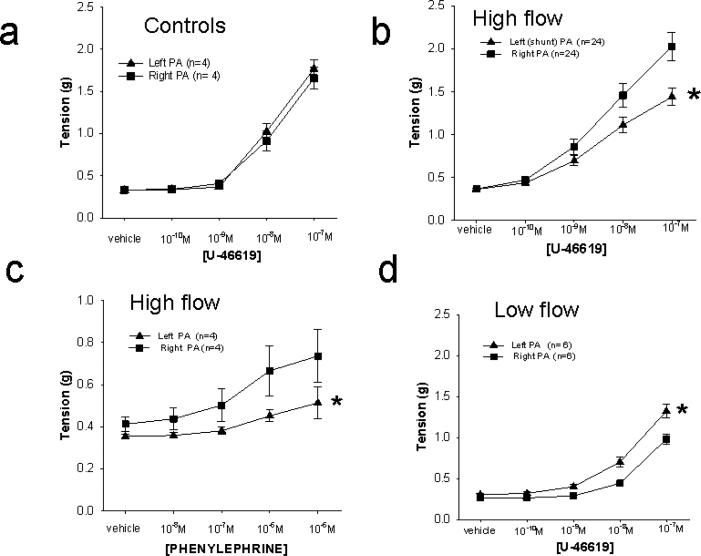
Figure 2.
Values for PAs from the right lower lobe are represented by filled squares (■). Those from the left lower lobe are represented by filled triangles (▲). Asterisks denote concentration curves that are different one from the other based upon two way repeated measure ANOVA (p<.05).
a. PAs from left and right lower lobes from control pigs develop equal tension to U46619 (n=4) in the concentration range of 10-10 through 10-7. This concentration range was chosen to develop a full tension response curve.
b. PAs from the right lower lobe of pigs with high flow shunts developed more tension to U46619 than did PAs from the left lower lobe (n=24; p<.005).
c. Right lower lobe PAs from pigs with high flow shunts exhibited increased tension to phenylephrine over left lower lob PAs from the same pigs (n=4; p<.05).
d. Left lower lobe PAs from low flow shunts exhibited very similar tensions to U46619 as those from high flow pigs, but lower tension in PAs from the right lower lobes (n=6; p<.01).
e. Right LLPAs from high flow hosts developed higher tension to U46619 than those from control (unoperated) hosts (n= 24 high flow, 6 control).
f. Tension to U46619 of left LLPAs from control and high flow hosts are not different (n=24 high flow, 6 control).


