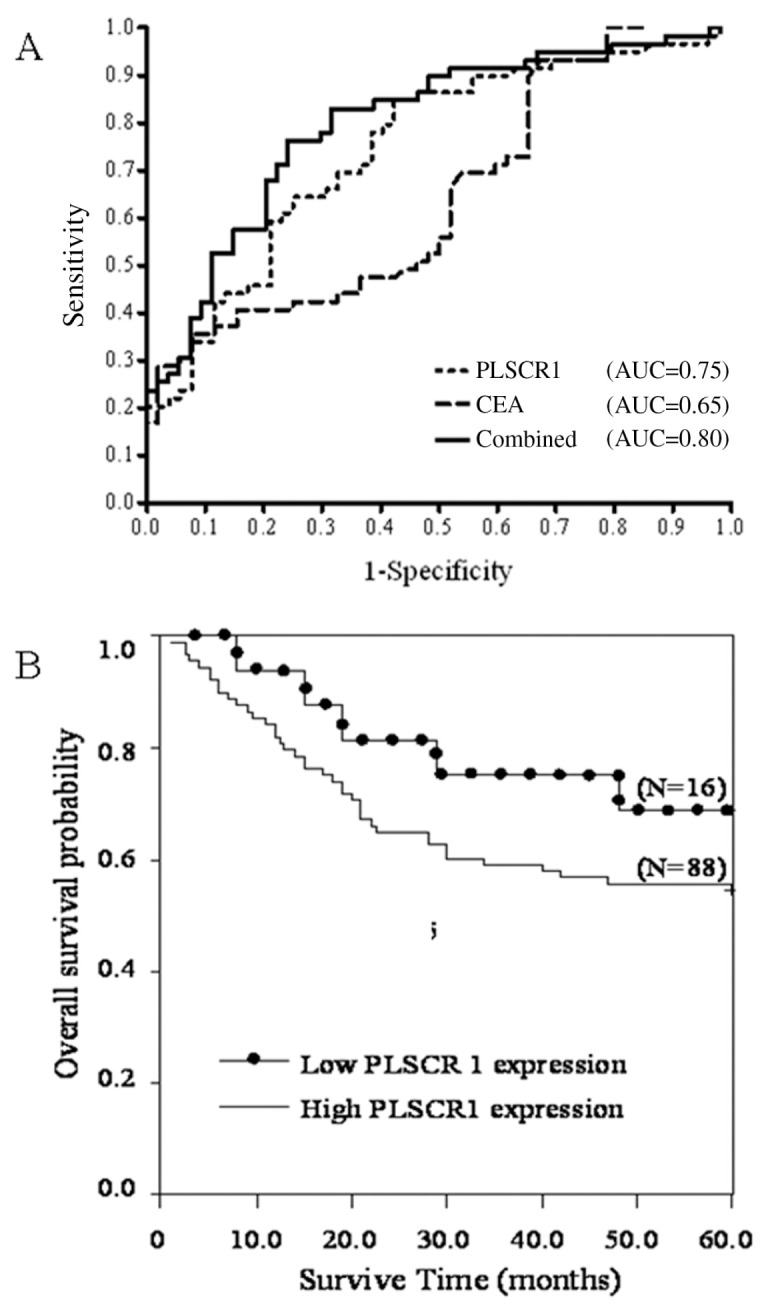
Figure 4.

(A) ROC curves for CEA and PLSCR1. Plasma concentrations of CEA and PLSCR1 among 59 CRC samples and 52 healthy control samples were determined by Western blot. The relationships between the specificity and the sensitivity of PLSCR1 and CEA for the detection of CRC are represented by ROC curves. The AUC value was 0.65 for CEA, 0.75 for PLSCR1 and 0.8 for both analyzed in combination. (B) Prognostic values of PLSCR1 expression for CRC patients. The Kaplan–Meier curve shows the relationship between 5-year overall survival and PLSCR1 expression. There was a significant correlation between PLSCR1 expression and shorter survival (P < 0.05).
