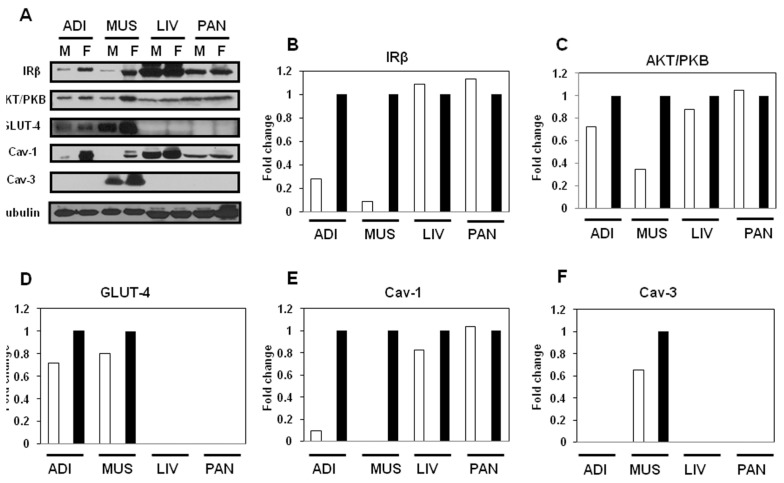
Figure 2.
Expression level of insulin-signaling molecules and caveolins in male and female JYD mice. (A) Insulin-signaling molecules and caveolin proteins were analyzed by Western blot in adipose tissue (Adi), skeletal muscle (Mus), liver (Liv) and pancreas (Pan) of male (M) and female (F) JYD mice at 30 wks of age. Tubulin was used to confirm equal loading. (B–F) Quantitative analysis of Western blots in tissues. The relative fold-change in male mice (white bars) to its control band (female mice, black bars) on Western blots was quantified by densitometric analysis.

