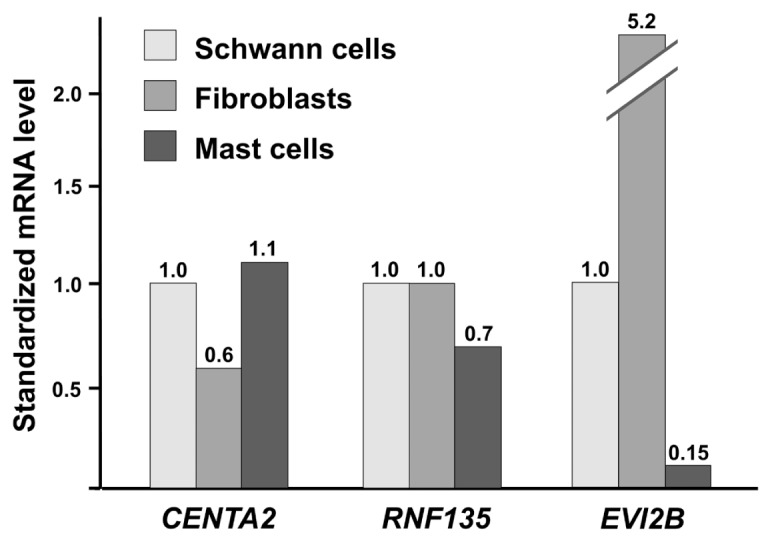
Figure 3.

mRNA expression of CENTA2, RNF135 and EVI2B in normal Schwann cells, fibroblasts and mast cells. For each gene, mRNA levels of the samples were normalized such that the value in Schwann cells was 1. The mRNA levels indicated are means of at least three independent experiments.
