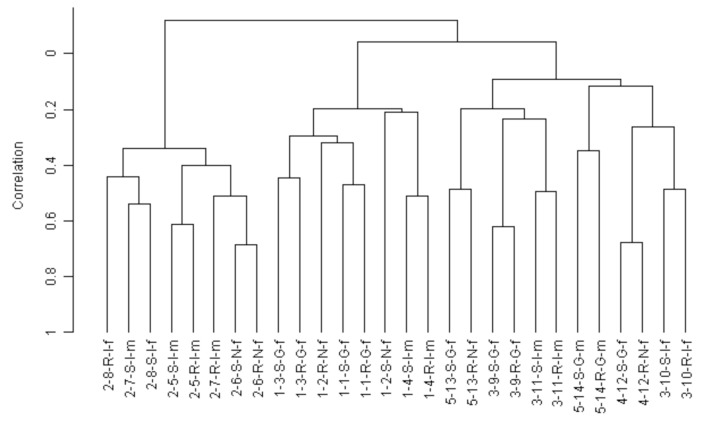
Figure 3.
Hierarchical clustering. Dendrogram constructed using BRB ArrayTools with centered correlation and average linkage. The branch labels give the experiment number (1–5), the subject number (1–14), clinical status, treatment, and gender. The samples from the first two experiments formed large clusters. For 11 of the subjects, the nearest neighbor for the stable sample is the corresponding relapse sample from that subject. There was no tendency to cluster by clinical status, treatment, or gender. S, stable; R, relapse; I, interferon; G, glatiramer; N, no treatment; m, male; f, female.

