4.

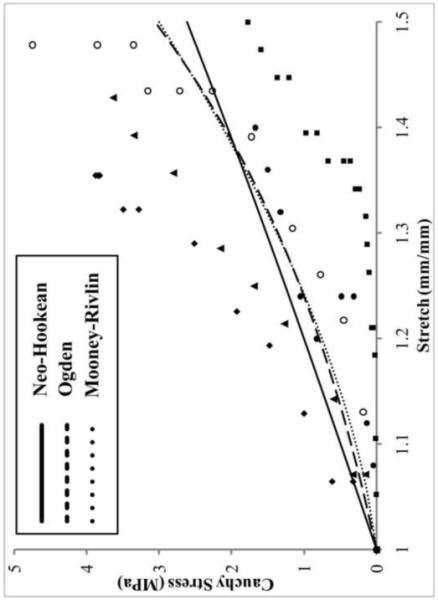
Cauchy stress-stretch curve showing hyperelastic curve fits to the experimental data for the medial posterior attachment site. Solid line = Neo-Hookean, dashed line= Ogden, dotted line = Mooney-Rivlin, symbols = testing data points for each specimen. The latter two models fit the trend of the data well. Mooney-Rivlin tends to describe samples with a large toe region better than Ogden, which favors specimens that have less compliant linear regions.
