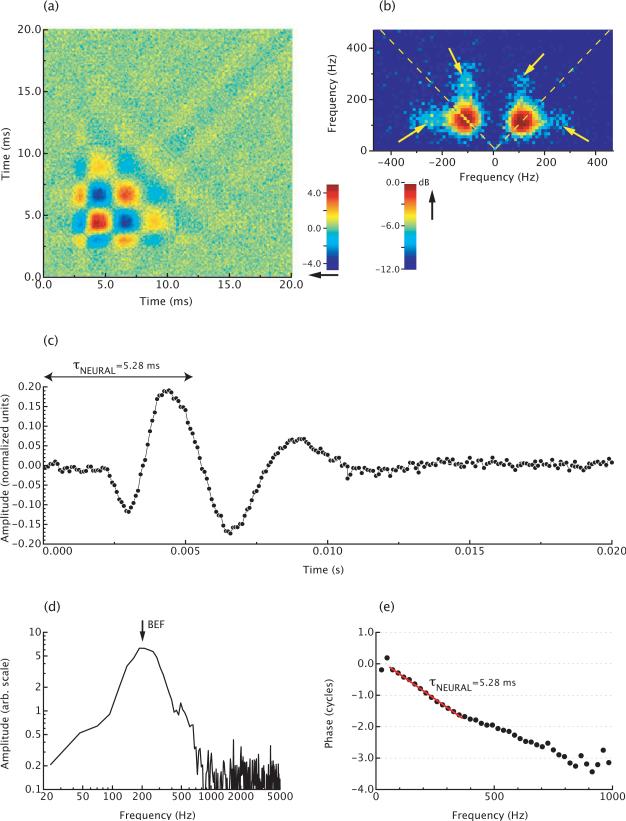
Figure 4.
Wiener kernel analysis of a low-frequency AP neuron in Rana esculenta, for which BEF=200 Hz. (a) Second-order Wiener kernel. The color code is an arbitrary scale. (b) Two-dimensional Fourier transform of the kernel. The arrows indicate the off-diagonal components in the kernel. These components reflect two-tone interactions in the neuron's response. The color code is in dB re. the peak value. (c) First singular vector of the kernel. This vector is interpreted to reflect the most prominent component of the neural response. (d) Amplitude spectrum of the response in (c). (e) Phase spectrum of the response in (c). The negative of the slope of the phase curve equals the group delay of the response, i.e. τNEURAL=5.28 ms.

