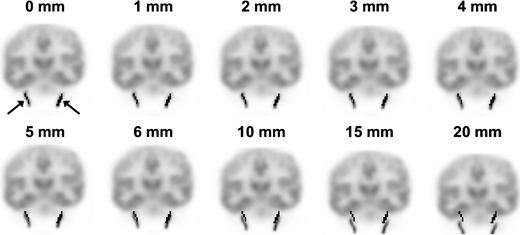
Fig. 2.

Coronal view of the last frame of the [11C]flumazenil simulated PET scan with on top the IDIF mask (black regions, indicated with two arrows in top left image) generated using the four hottest pixels per plane method. The simulated PET scan has different amounts of translational movement.
