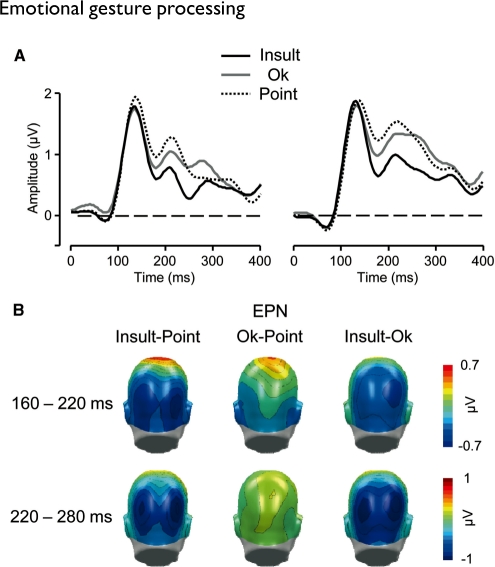
Fig. 3.
(A) Illustration of the EPN component showing representative left and right occipital sensors (EGI 105 and 178). (B) Scalp potential maps of the difference waves ‘Insult–Point’, ‘OK–Point’ and ‘Insult–OK’ for the early (160–220 ms) and late (220–280 ms) EPN time window. A back view of the model head is shown.

