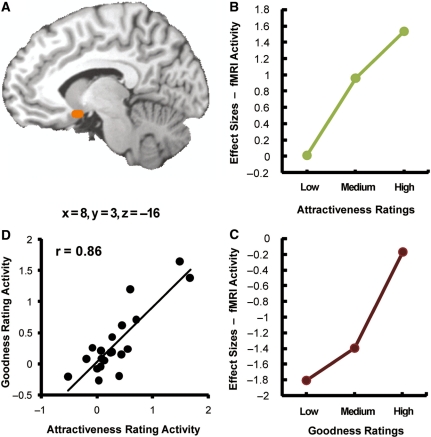
Fig. 3.
(A) Right medial OFC region where activity increased simply as a function of both attractiveness and goodness ratings. (B) Increase in OFC activity as a function of attractiveness ratings. ‘Low’ corresponds to ratings 1–3, ‘Medium’ to ratings 4–5 and ‘High’ to ratings 6–8. (C) Increase in OFC activity as a function of goodness ratings. ‘Low’, ‘Medium’ and ‘High’ correspond to ratings 1–3, 4–5 and 6–8, respectively. (D) Changes in OFC activity as a function of attractiveness and goodness ratings were highly correlated (r = 0.86, P < 0.01).

