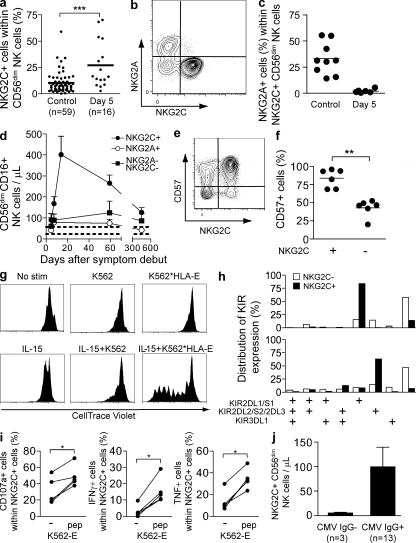
Figure 4.
Expansion of NKG2C+ NK cells. (a) Frequency of NKG2C+ cells within the CD56dim NK cell population on day 5 after onset of symptoms in hantavirus-infected patients compared with noninfected controls (n = 16 infected, 59 uninfected; ***, P < 0.0001, unpaired Student’s t test; mean). (b) Representative example of costaining for NKG2A and NKG2C on CD56dim NK cells in hantavirus-infected patient at day 5 after onset of symptoms. (c) Co-expression of NKG2C and NKG2A evaluated at day 5 in infected (n = 6) and uninfected control (n = 9) individuals (horizontal bars represent mean). (d) Numbers of NKG2C+, NKG2A+, and NKG2C−NKG2A− CD56dimCD16+ NK cells evaluated longitudinally from day 5 until day 450 after onset of symptoms in infected patients (n = 6; mean ± SEM). Dashed lines represent the upper and lower SEM intervals for mean of NKG2C+ NK cell numbers in control individuals (n = 26). (e) Representative example of costaining for NKG2C and CD57 on CD56dim NK cells in one hantavirus-infected patient at day 60 after onset of symptoms. (f) Expression of CD57 evaluated at day 60 after symptom debut (n = 6) in NKG2C+ and NKG2C− CD56dim NK cells (**, P = 0.0022, Mann-Whitney test; mean). (g) Proliferation of NKG2C+ NK cells after stimulation with IL-15 and/or target cells measured by dilution of CellTrace violet. Purified NK cells were incubated for 7 d with or without irradiated K562 cells or K562*HLA-E cells, and in the absence (top) or presence (bottom) of IL-15. One representative experiment out of two is shown. (h) Expression pattern of the three major KIRs on NKG2C+ and NKG2C− NK cells. In one representative donor, a majority of the NKG2C+ NK cells were single positive for KIR2DL1/S1 (top), whereas the second representative donor shows a selective expression of KIR2DL2/S2/2DL3 (bottom) in the NKG2C+ population (see Fig. S4 for separation between activation and inhibitory KIRs). Two representative donors out of five analyzed are shown. (i) Degranulation and cytokine production responses quantified in NKG2C+ CD56dim NK cells from patients in the convalescent phase of infection after triggering with K562-E cells with or without addition of an HLA-E stabilizing peptide (n = 5; *, P < 0.05, Mann-Whitney test). (j) Absolute numbers of NKG2C+ CD56dim NK cells in CMV IgG− and IgG+ infected individuals at day 5 (mean ± SEM).

