
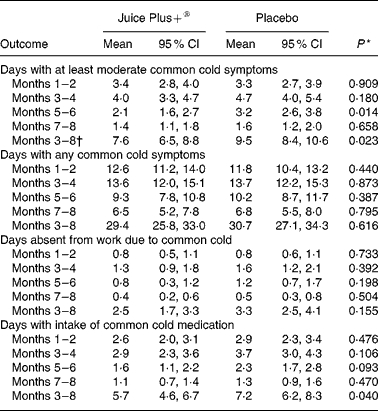
Table 2. Primary and secondary outcomes with respect to time period of occurrence and within 6 months after 8-week run-in phase (months 3–8).
(Mean values and 95 % confidence interval)
*
P values from ANOVA.
†
Primary outcome.
Official websites use .gov
A
.gov website belongs to an official
government organization in the United States.
Secure .gov websites use HTTPS
A lock (
) or https:// means you've safely
connected to the .gov website. Share sensitive
information only on official, secure websites.
(Mean values and 95 % confidence interval)
P values from ANOVA.
Primary outcome.