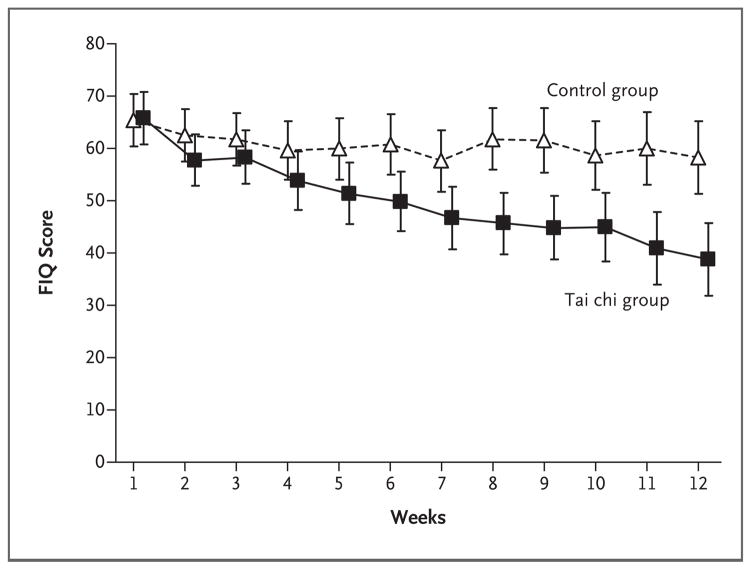
Figure 3. Fibromyalgia Impact Questionnaire (FIQ) Scores during the 12-Week Intervention Period, According to Treatment Group.
FIQ scores, measured weekly over the 12-week intervention period, are shown for the tai chi group and the control group. The FIQ scores range from 0 to 100, with higher scores indicating more severe symptoms and lower scores indicating improvement in outcomes. The values shown are unadjusted means; the data points are slightly offset for clarity. I bars indicate 95% confidence intervals.

