Fig. 5.
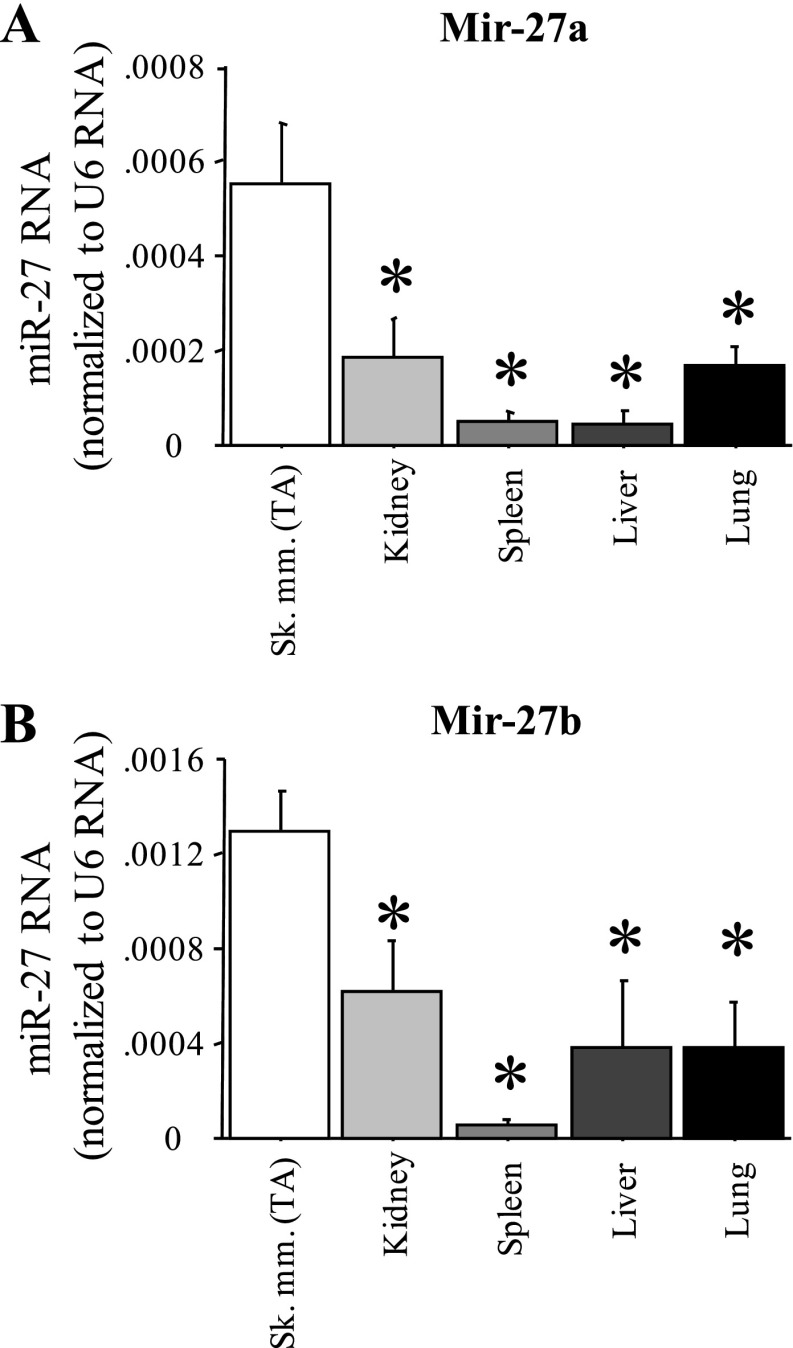
Muscle-enriched expression of miR-27a and b. Quantitative real-time PCR quantification of miR-27a (A) and miR-27b (B) levels relative to U6 RNA control for five different mouse tissues. Sk mm, skeletal muscle. Bars represent means ± SE for n = 4 tissues. *Significantly different from TA, P < 0.05.

