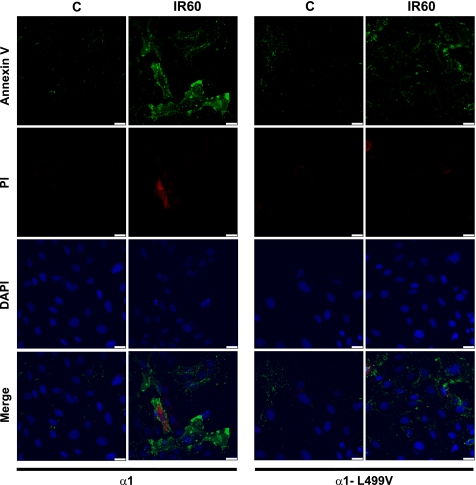
Fig. 2.
Annexin V/propidium iodide (IP) staining in Na+-K+-ATPase α1- and α1-L499V-expressing OK cells exposed to ischemia followed by reperfusion. After treatment, fluorescent staining of Annexin V (green), PI (red), and DAPI (blue) was performed as described in methods, and cells were examined by fluorescence confocal microscopy. C, control (110 min KH); IR60, 20 min KH/30 min substrate/coverslip-induced ischemia/60 min KH. Pictures are representative of at least 10 fields observed in 3 different preparations for each condition in Na+-K+-ATPase α1- and α1-L499V-expressing OK cells. Scale bar = 25 μm.

