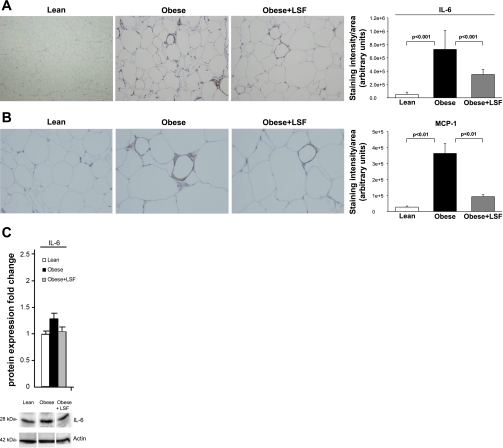
Fig. 7.
Protein expression of IL-6 and MCP-1 in visceral adipose tissue from obese Zucker rats and effect of LSF. IL-6 (A) and MCP-1 immunostaining and quantification (B) showing increased number of immunnopositive cells in obese Zucker rats compared with lean rats and reduced staining in LSF-treated compared with saline-treated obese rats. Magnification is ×200 in A and ×400 in B. For quantification of the immunohistochemical data, 6 different fields from 3 rats/group were analyzed. C: bar graph illustrating quantification of the Western blot densitometry analysis for IL-6 expression from the same groups of rats, and representative blots are shown below. Data are expressed as fold change compared with lean rats normalized to actin and are representative of 6–7 rats/group.

