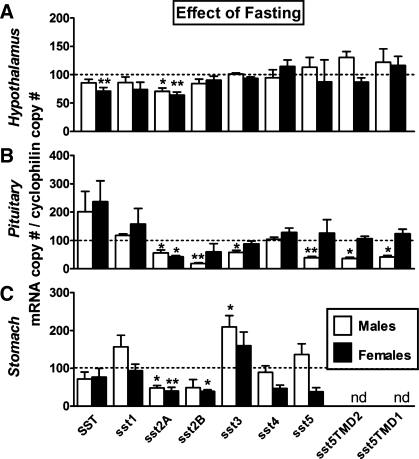
Fig. 3.
Effect of fasting on SST and sst in HPT (A), PIT (B), and STO (C) of male (open bars) and female (filled bars) mice. mRNA copy numbers were assessed by qrtRT-PCR. Values are shown as relative percentage of male or female fed control mice (shown by the dotted line set at 100%) and represent the mean ± SE of 4–9 mice/sex/tissue. Symbols (*P < 0.05, **P < 0.01) indicate values that significantly differ from fed controls within sex.

