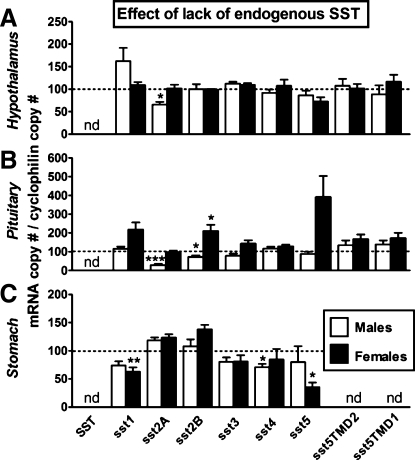
Fig. 5.
SST and sst expression in HPT (A), PIT (B), and STO (C) of male and female wild-type (SST-intact control mice shown by the dotted line set at 100%) compared with male (open bars) and female (filled bars) SST-KO mice, as assessed by qrtRT-PCR. Values represent the mean ± SE of 4–9 mice/sex/tissue. Symbols (*P < 0.05, **P < 0.01, ***P < 0.001) indicate values that significantly differ from SST-intact within sex. nd, Not detected.

