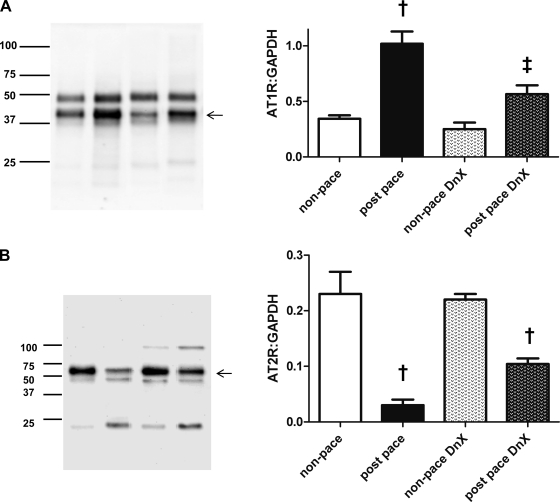
Fig. 5.
Angiotensin receptor expression in kidney microvasculature (protocol 3). A: ANG II type 1 receptor (AT1R) was measured in a microvessel-enriched lysate obtained from 4 separate groups of animals (see materials and methods) and normalized to the loading control GAPDH. †P < 0.05 vs. respective nonpaced group. ‡P < 0.05 vs. postpace; n = 5 except n = 4, nonpaced DnX. B: ANG II type 2 receptor (AT2R) was measured in a microvessel-enriched lysate obtained from 4 separate groups of animals (see materials and methods) and normalized to the loading control GAPDH. †P < 0.05 vs. respective nonpaced group. ‡P < 0.05 vs. postpace; n = 5 except n = 4, nonpaced DnX. Arrows denote bands representing AT1R (A) and AT2R (B). Presence of the doublet at the site of the band of interest is likely detection of a posttranslational modification of the receptor. Fainter bands detected are likely nonspecific binding or protein fragments.

