Fig. 5.
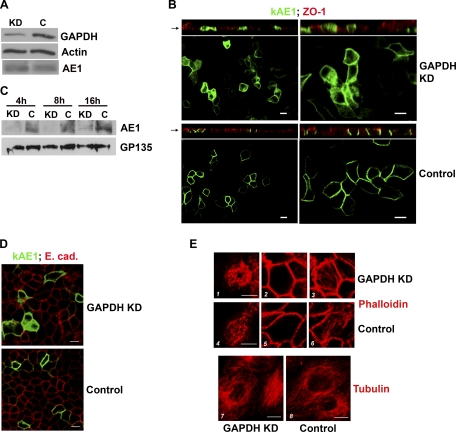
Knockdown of GAPDH decreases kAE1 protein on the surface of polarized MDCK cells. Cells were transfected with 2 rounds of small interfering (si) RNA against GAPDH (KD) or scrambled sequence (C) over 2–3 days. A: Western blot analysis of cell lysates: densitometry confirmed ∼90% knockdown of GAPDH protein compared with control cells. Levels of kAE1 were similar; β-actin was a loading control. B: localization of full-length enhanced green fluorescent protein (eGFP)-tagged kAE1 in polarized MDCK cells by confocal microscopy (left low power, right high power). GAPDH-depleted cells retained polarization, as shown by the tight junctional marker ZO-1 (top, XZ sections, red stain), but AE1 was significantly intracellular (top, XY sections, green) compared with GAPDH-replete cells (bottom, XY sections). C: cell surface proteins were isolated following biotinylation at various times post-AE1 induction. At all time points, membrane levels of AE1 were severely depleted in knockdown cells (KD lanes) compared with control cells (C lanes). GP135, an apical membrane protein detected on the same blot, was used as a loading control. D: basolateral localization of E-cadherin was preserved in both KD (top) and control cells (bottom). E: preservation of cytoskeletal integrity: F-actin stained by phalloidin demonstrated no significant differences between KD (1–3) and control cells (4–6). 1 and 4, Cross sections through microvilli; 2 and 5, below terminal web; 3 and 6, basal. Similarly, there were no differences in tubulin staining between KD (7) and control (8) cells. Bars = 10 μm.

