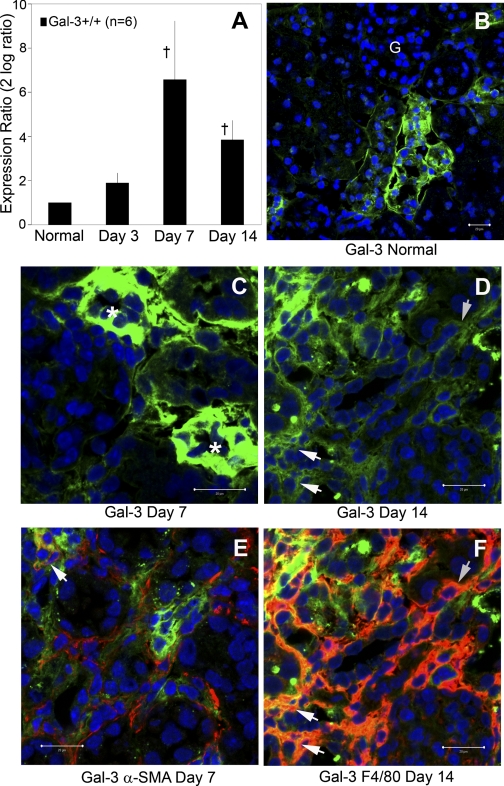
Fig. 1.
Galectin-3 (Gal-3) expression is increased after unilateral ureteral obstruction (UUO) in tubular and interstitial cells. A: graph summarizes analysis of relative Gal-3 mRNA expression normalized to 18S, UUO relative to contralateral, by semiquantitative real-time qPCR (†P < 0.01; n = 6) in wild-type mice. Representative confocal photomicrographs of Gal-3 (green) localization demonstrated low basal expression in tubular cells of normal kidneys (B) that is upregulated in tubular cells (*) at early time points (C) and transitioned to interstitial cells (arrows) by day 14 (D). A small subpopulation of α-smooth muscle actin (α-SMA+; red) myofibroblasts expressed Gal-3 (yellow merged, indicated by arrow; E) while the majority of the Gal-3 interstitial cells are F4/80+ (red) macrophages (F; arrows indicate an aggregated subpopulation of dual stained Gal-3+F4/80+ cells). Bar = 20 μm. Magnification ×400. G, glomeruli.

