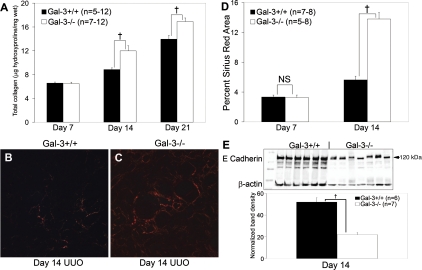
Fig. 2.
A: total kidney collagen content measured by the hydroxyproline assay is significantly increased in obstructed kidneys from Gal-3-deficient mice compared with wild-type mice. B and C: representative polarized light microscopy photomicrographs (×200) illustrate increased collagen deposition by Picrosirius red staining at day 14 in Gal-3-deficient mice. D: graph summarizes the results of polarized Picrosirius red quantification by computer-assisted image analysis, expressed as the percent positive area. E: renal E-cadherin Western blot illustrates significantly lower levels in Gal-3-deficient mice at day 14 after UUO reflecting the loss of intact tubules. The graph below summarizes the results of single-band density measurements, expressed as β-actin-normalized E-cadherin band levels. Filled bars represent wild-type mice and open bars represent Gal-3-deficient mice. Results are expressed as means ± SE. †P < 0.01, wild-type vs. Gal-3-deficient.

