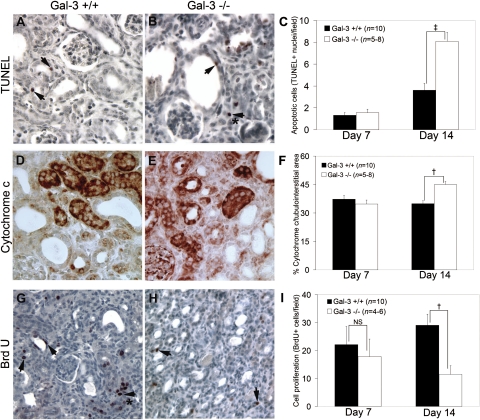
Fig. 3.
A and B: representative photomicrographs (×400) and the graph (C) demonstrate increased TdT-mediated dUTP nick end labeling (TUNEL+) cells in Gal-3-deficient mice on UUO day 14. The arrows highlight TUNEL+ tubular cells and the (*) interstitial cells. D and E: representative photomicrographs illustrate more cytochrome c-positive tubules in Gal-3-deficient mice and the graph (F) summarizes total cytochrome c levels on UUO day 14. G and H: representative photomicrographs illustrate more proliferating BrdU+ tubular and (*) interstitial cells in wild-type mice and the graph (I) summarizes the differences in proliferating BrdU+ cells on UUO day 14. All results are expressed as means ± SE. NS, not significant. †P < 0.05, ‡P < 0.01, wild-type vs. Gal-3-deficient.

