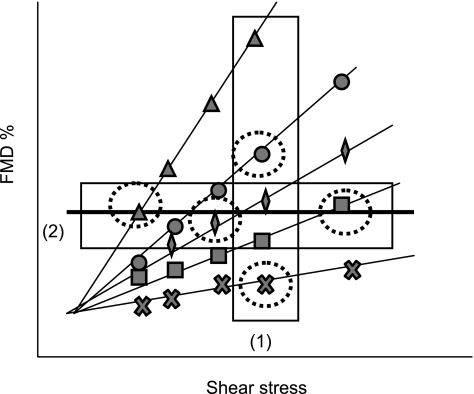
Fig. 4.
Hypothetical data in which no between-subject relationship between shear and FMD is observed despite the presence of (variable) within-subject shear-FMD relationships. Thin solid lines represent within-subject shear-FMD relationships when exposed to 5 different shear-stress stimuli. Circled points represent the shear-stress stimulus and FMD response in each subject during a single reactive hyperemia test. The thick solid line represents the between-subject shear-FMD relationship. Box 1 represents a selection of data in which subjects received the same shear-stress stimulus. In this selection it is straight-forward to conclude that differences in the FMD response represent biological variability in steps 2-4 described Fig. 1. Box 2 represents a selection of data in which subjects have the same FMD response but experienced very distinct shear-stress stimuli. In this data selection the subjects have differences in endothelial function, and only the variable shear-stress stimulus has allowed them to experience a similar FMD response. This highlights the importance of determining an effective method to account for the stimulus magnitude.

