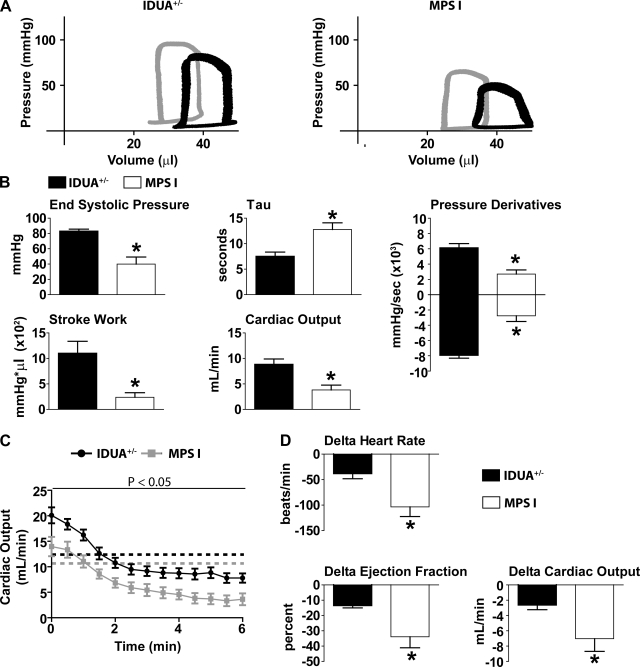
Fig. 3.
Hemodynamic function during esmolol infusion. A: representative pressure-volume loops of IDUA+/− (left) and MPS-I (right) mice after 5 min of esmolol. Gray loops, baseline; black loops, esmolol. B: mean hemodynamic data showing differences in cardiac performance after 5 min of esmolol. τ, preload independent measure of ventricular isovolumic relaxation. C: change in cardiac output from baseline to steady-state esmolol. Dotted lines demarcate baseline values for each cohort (black, IDUA+/−; gray, MPS-I). D: mean hemodynamic values showing the change from baseline to steady-state esmolol function (5 min). *P < 0.05 by t-test. IDUA+/−, n = 7; MPS-I, n = 6.

