Fig. 2.
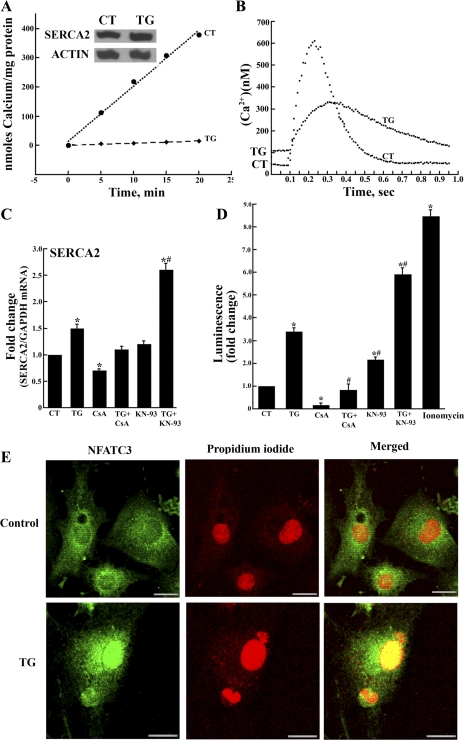
TG inhibits Ca2+ transport and Ca2+ signaling but increases sarcroplasmic reticulum Ca2+ transport ATPase (SERCA2) transcript and protein levels, expression of nuclear factor of activated T-cell (NFAT)-dependent luciferase, as well as NFATc3 nuclear translocation. A: ATP-dependent Ca2+ transport (measured as described in methods) and protein levels (SERCA2) in homogenates of cardiac myocytes (control or exposed to 10 nM TG for 7 days). Results are given as means ± SD from (n = 4). For calcium transport, the variations of TG-treated myocytes when compared with control myocytes were significant with P = 0.05 (Student's two-tailed t-test). Inset: SERCA2 protein levels were measured by Western blot analysis and compared with the levels of actin protein. B: Ca2+ signaling in cardiac myocytes. Cells (control or exposed to 10 nM TG) were loaded with Fura-2 and subjected to field stimulation. Fluorescence was measured at 340 and 380 nm excitation (see methods). Each trace represents the average of transients obtained from 25 cells per group over three separate experiments. Statistical significance was determined by Student's two-tailed t-test. The threshold for statistical significance was set as P < 0.05 following a Student's two-tailed t-test. C: SERCA2 transcript levels in control myocytes and myocytes exposed to TG (10 nM), CsA (0.2 μM), TG + CsA, KN-93 (5 μM), and TG + KN-93 added 24 h after seeding. Transcript levels were determined by RT-PCR. Data are means ± SD from n = 6 preparations. Statistical significance was determined by ANOVA. *Significance (P < 0.05) versus control and all other treatments; #significance (P < 0.05) versus TG. D: NFAT-dependent luciferase expression. Control myocytes and myocytes exposed to TG (10 nM), CsA (0.2 μM), TG + CsA, KN-93 (5 μM), TG + KN-93, or ionomycin (3.0 μM, in the absence of TG) added 24 h after seeding were transfected with cDNA encoding luciferase under the control of NFAT-dependent promoter. The cells were harvested 24 h later for determination of luciferase expression by luminescence assay. Data are means ± SD from n = 4 preparations. Statistical significance was determined by ANOVA. *Significance (P < 0.05) versus control; #significance (P < 0.05) versus TG or KN-93. E: immunostaining of myocytes with total NFATc3 reactive antibodies (shown in green) and with propidium iodide for nuclear stain (shown in red). Merging demonstrates nuclear localization (yellow color) of NFATc3 in myocytes exposed to TG. The magnification bar corresponds to 15 μm.

